Create a churn and other things chart

  • Durum: Closed
  • Ödül: $25
  • Alınan Girdiler: 3
  • Kazanan: dipkmr

Yarışma Özeti

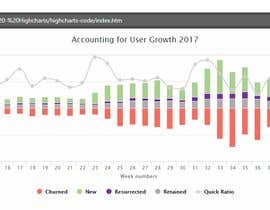
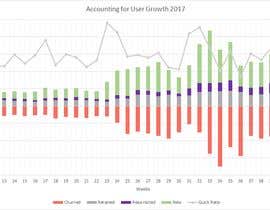
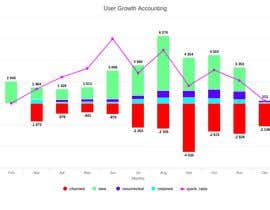
Using Highcharts create a graph from the dataset provided. The chart must be like the one attached, but weekly not monthly.

Aranan Beceriler

İşveren Geribildirimi

“I appreciate to work with Deepak”

Profil Görüntüsü QuieroHacerlo, Argentina.

Bu yarışmadan başlıca girdiler

Daha Fazla Girdi Görüntüleyin

Genel Açıklama Panosu

  • wolfrain
    wolfrain
    • 6 yıl önce

    Hi! Recently I went up the final entry where the chart was generated from Highchart. The entry is #5 . If you have any questions, do not hesitate to contact me!

    • 6 yıl önce
  • wolfrain
    wolfrain
    • 6 yıl önce

    Hi! I'm still working on the contest. I have already elaborated the values corresponding to the fields new, retained, churned and resurrected using the weekly value as a time interval. Now I just have to elaborate the graph using Highcharts and the values obtained to be able to raise the final result!

    • 6 yıl önce
  • wolfrain
    wolfrain
    • 6 yıl önce

    Hi! I'm working on the contest. You need a graph for Accounting of User Growth, and all the dataset is correct for that. I'll be making all the calculations in database and later, I'll be adjusting the results in a small HTML file using Highcharts

    • 6 yıl önce
  • LouQ
    LouQ
    • 6 yıl önce

    Hi. I don't see how we are able to generate six variables from the dataset. EG. ID 125639 appears 5 times in the CSV: 3 times against 1/2/2017 and 2 times against 13/8/2017. However none of these 5 events are classified as any particular type of event, e.g. acquired, closed, etc.

    • 6 yıl önce
  • QuieroHacerlo
    Yarışma Sahibi
    • 6 yıl önce

    On weekly basis

    • 6 yıl önce
  • QuieroHacerlo
    Yarışma Sahibi
    • 6 yıl önce

    No, you should calculate the six variables with the dataset provided:

    • 6 yıl önce
  • Evgen64
    Evgen64
    • 6 yıl önce

    Hello! There are only two variables in the data file, and there are 6 variables in the graph sample?

    • 6 yıl önce

Daha fazla yorum göster

Yarışmalara nasıl başlanır

  • Projenizi ilan edin

    Yarışmanızı İlan Edin Hızlı ve kolay

  • Tonlarca girdi alın

    Tonlarca Girdi Alın Bütün dünyadan

  • En iyi girdiyi seçin

    En iyi girdiyi seçin Dosyaları indirin - Kolay!

Şimdi bir Yarışma İlan Et ya da Bugün Bize Katılın!