Data Visualisation
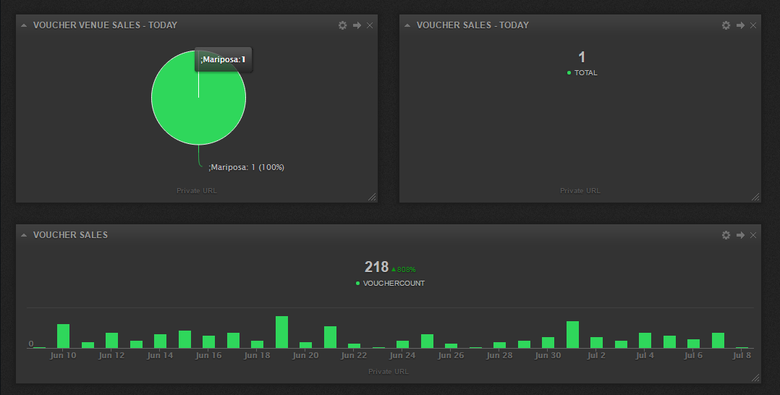
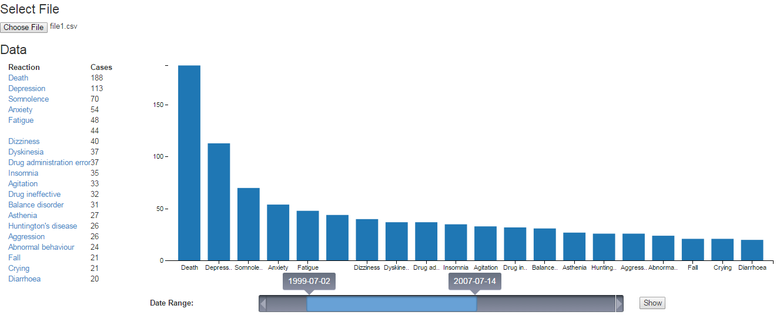
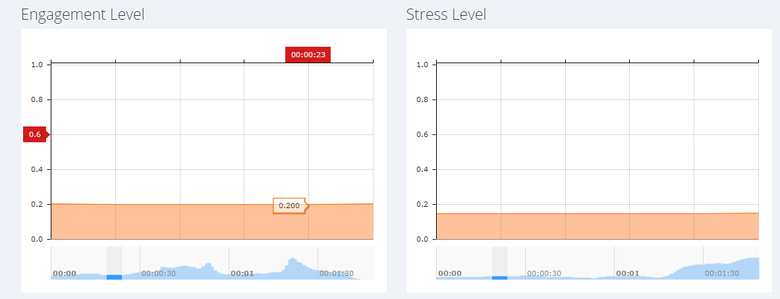
In recent years, I have worked on various javascript chart/graph libraries(epoch, amcharts, highcharts) to display data and analyse it. The data can be picked up from a csv, a web api(json, xml) or even a database. The charts have various features to analyse data viz. zoom(daily, weekly, yearly), realtime data(stocks etc)\n\nI am attaching few of my charts from various projects

Hakkımda
I am an Individual Full Time Freelance Programmer having 12.5+ years expertise in MS Technologies. Prior to working as freelancer(before 2014), I was associated with Microsoft & AMEX as vendor and have worked on various projects/applications for them. There are few things which differentiate me from other guys here i.e.. 1. Honesty & Pace. 2. Have good analytic skills. 3. Strong Grasping Power. 4. Quality code using Best Practices. 5. Data Structure & Algorithms. In recent years, I have worked on major below items 1. Migration: VB6 to .Net Application, Classic ASP to , .Net Framework Upgrade, Sql Server to/from to MySql etc. 2. Scrapping/Extracting/Parsing: Get data, store data and schedule to scrap on regular intervals. 3. Maintenance & Enhancements 4. Data Visualizations: Chart&Graph 5. Teaching I am having good technical skills but not bound to few technologies