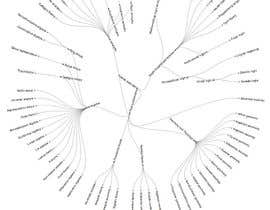
Visualize all the domains of Mathematics
- Durum: Closed
- Ödül: $50
- Alınan Girdiler: 1
- Kazanan: kmande

Yarışma Özeti
I have several categorical datasets that I need visualised in the next few months and beyond. The example is only 78 cases long and needs to represent each of the categories and subcategories of mathematics visualised in a way that connects with the logo for our group. Although this could be done in Illustrator, we have more, larger, data sets and I will award this contest to someone who can do these visualizations in R or Python but can do so with an eye to design (possibly, but not necessarily, using a graphics program as well).
Please try to match the Math section of the attached logo.
Maths.xlsx is the categorical data file.
#33Icon is the Logo.
All other files are just to give ideas.
The winning applicant will be offered additional work immediately. Good luck!!
Aranan Beceriler
İşveren Geribildirimi
“Excellent and skilled freelancer.”
![]() lawrencejosh, United States.
lawrencejosh, United States.
Genel Açıklama Panosu

Yarışmalara nasıl başlanır
-

Yarışmanızı İlan Edin Hızlı ve kolay
-

Tonlarca Girdi Alın Bütün dünyadan
-

En iyi girdiyi seçin Dosyaları indirin - Kolay!